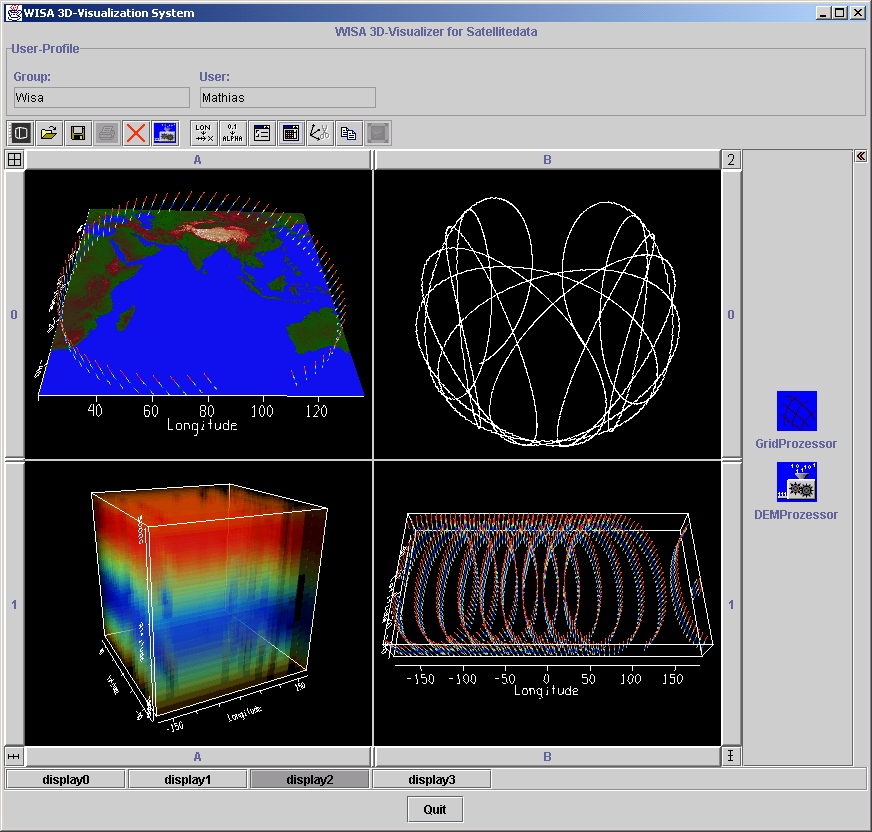
(click on the image to enlarge)
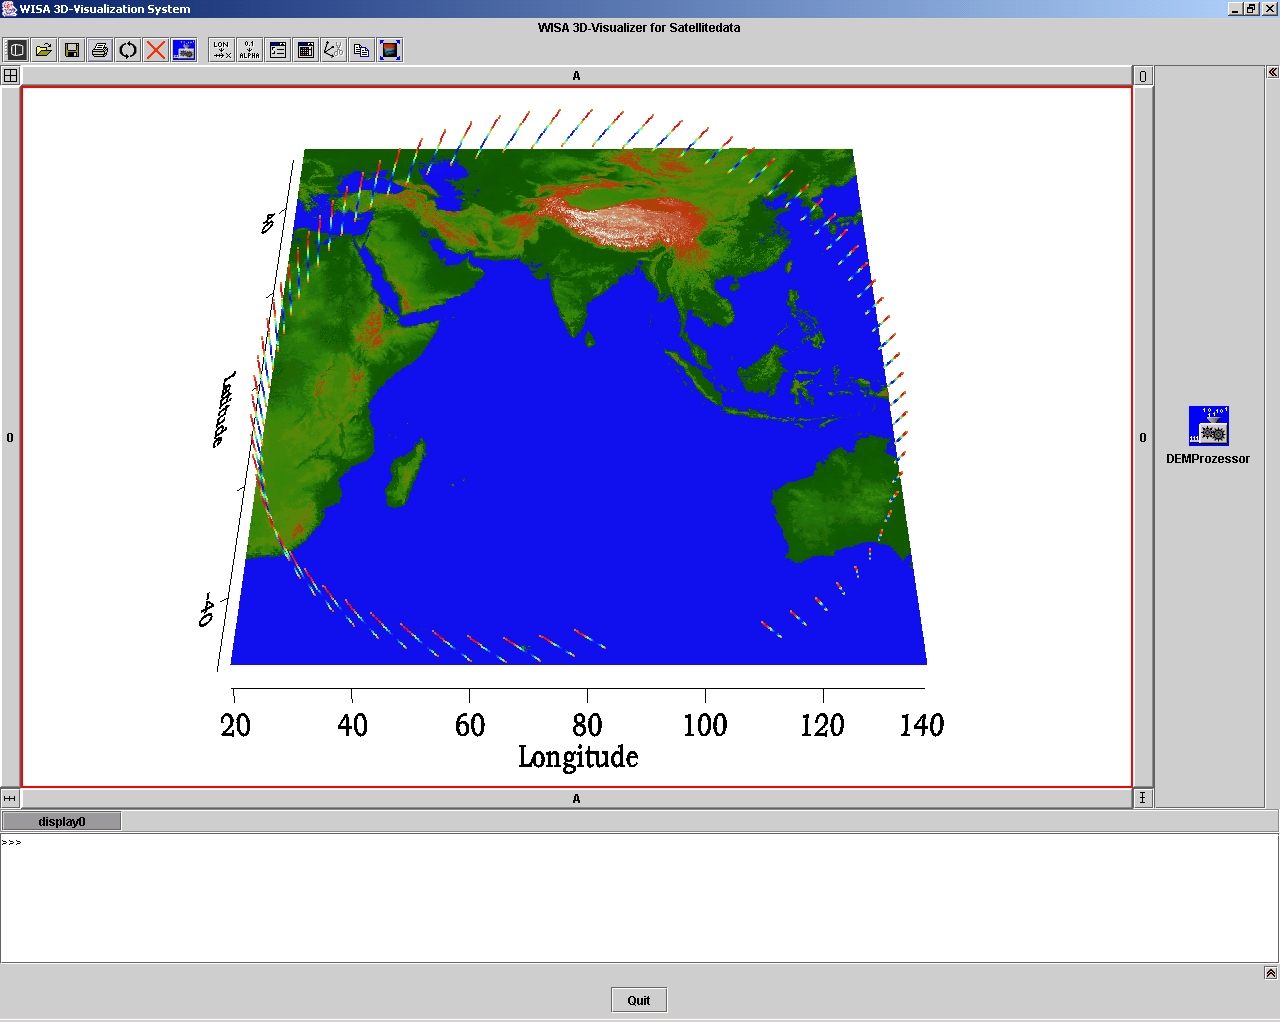
(click on the image to enlarge)
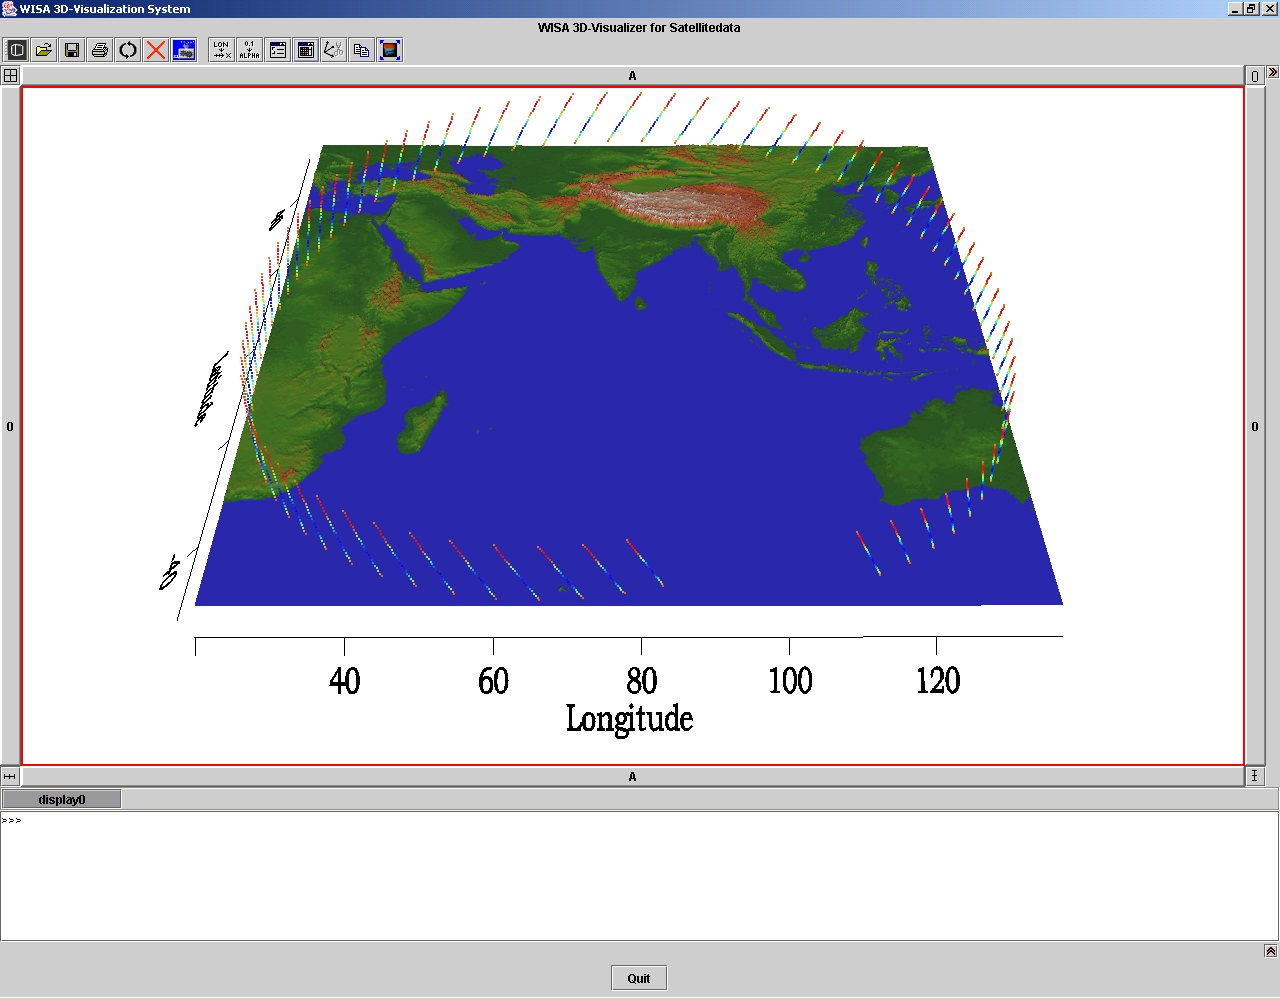
(click on the image to enlarge)
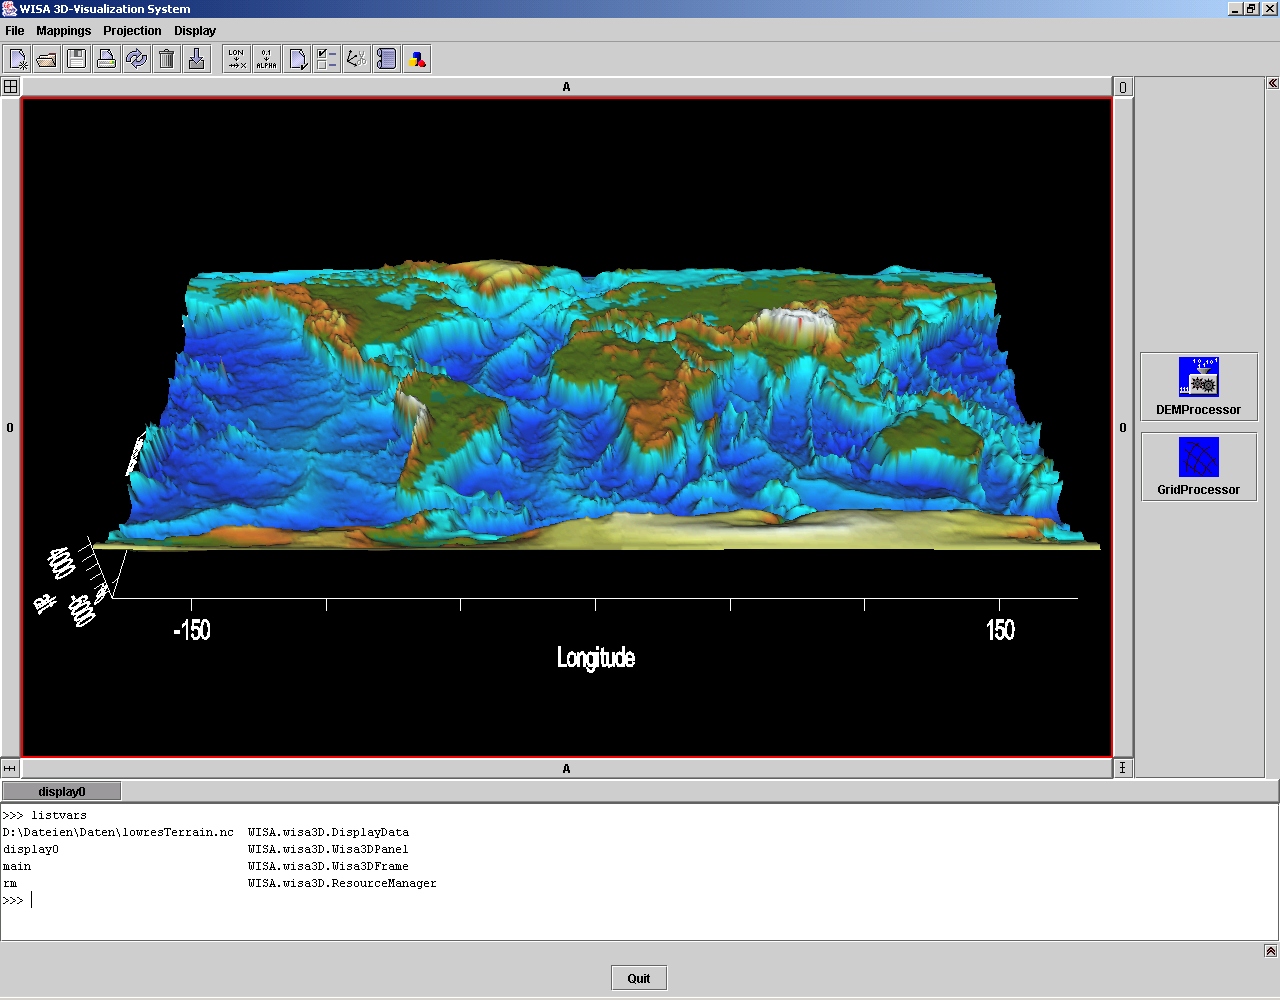
(click on the image to enlarge)
The newest user interface of Wisa3D in respect to the Java look and feel guidelines. There is a global low resolution elevation data visualized which also contains submarine elevation data.